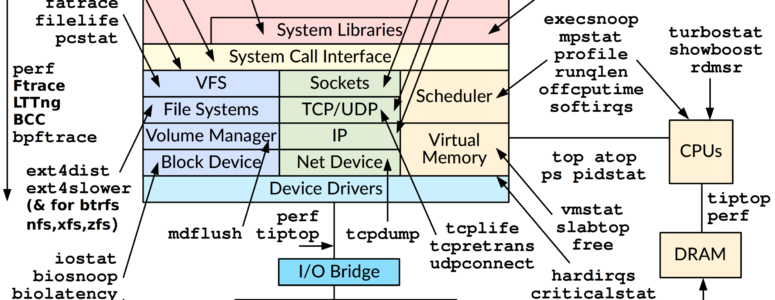
Linux Performance Observability Tools. Sysstat.
Usually sysstat is not installed by default, so to start using it, you need to install it. Use your distribution’s package manager to install the package. For all Linux distributions, the package name is sysstat.
After installing the package, we can immediately start using the following utilities:
pidstat – Displays the current statistics about the running process or a set of processes. A very handy tool if we need to watch a particular process. This tool is suitable to use after the top utility, for a more detailed monitoring. The utility displays data on CPU usage, memory utilization, paging, input-output and other specific items related to the observed process.
mpstat – a utility for displaying CPU related statistics. It displays CPU usage and interrupts. In my practice, I almost never use this utility, usually top is enough.
iostat – this tool, in my practice, is the most commonly used. Iostat shows detailed statistics on disk subsystem. This tool is used in case of any concern about the slow performance of the disk subsystem. Iostat provides data on the current bandwidth (bytes or IOPS), the number of requests in the device queue, the average size of the requests, read and write latency. And the most favorite metric is the disk utilization in percent.
And last, theres are two more utilities: cifsiostat and nfsiostat-sysstat/nfsiostat. These tools are similar to iostat, and allow you to view statistics on utilization of CIFS and NFS file systems. They provide information on data throughput, number of read/write operations and similar things.
Now consider the possibility of gathering and view historical data. Ability to collect metrics is disabled by default, and must be enabled separately. Usually this is done with cron. However, different distributions use different approaches. For example, in Debian/Ubuntu you need to edit the /etc/default/sysstat file. In OpenSUSE, you need to make a symlink in /etc/cron.d/ to /etc/sysstat/sysstat.cron. For details, see the sysstat package installation instructions for your Linux distribution.
$ sar -u -f /var/log/sa/sa20But be careful: history files location may be different for your Linux distribution.
Now let’s look at the tools to work with historical data:
sar – as you already know, displays the previously collected data in a human readable format. The most commonly used utility.
And utilities that you almost never have to run by hand:
sadc – collects and stores data on system activity.
sadf – allows you to display the data collected in different formats (csv, xml, json).
sa1 – shell-script wrapper over sadc which is used in the cron.
sa2 – shell-script wrapper over sar to create daily reports based on the data collected.Now the word of introduction to sysstat is over. In the next posts, I will talk about the most frequently used tools, iostat and sar.


