

Deep dive into postgres stats: Introduction
Everything you always wanted to know about PostgreSQL stats
In these blog series I will try to explain how to use stats effectively and how to detect and solve problems with their help. I will start with an overview and will move on discussion on specific usages with receipts and built in tools.
I hope my posts will provide you with some hands-on tools that will help you using postgres stats and will reassure you that stats aren’t as scary as they seems at first glance.
What is postgres? For people who are not familiar with postgres, it’s a bunch of processes in the ‚ps auxf‘ output. What they can see are operating system’s metrics, such as CPU usage, memory or swap consumed by these processes, but nothing more. This, however, is not sufficient to effectively troubleshoot postgres. To do that one needs to know how postgres stats are collected throughout postgres lifetime and to also be able to properly use them.
Even provided all these strengths, stats also have a few weak points. First, is the fact that there are so many of them and one should know which source to use in each particular case. Second, almost all stats are provided as permanently incremented counters and often you can see billion values that say nothing to you. Third, stats don’t provide history, so there is no built-in way to check what happened five, ten or thirty minutes ago. And last and the least is that postgres doesn’t provide handy tool for working with stats, and end-user has to use only sql clients, such as psql.
Despite all that, stats are the first thing which can help you to troubleshoot postgres. Let’s take a closer look. Stats provide different types of information, these are
- Events that happened in postgres instance (counters), such as table or index operations, number of commits and rollbacks, such as block hits, reads etc.
- Database’s objects properties (current values), e.g. transactions or queries start time and states and relations sizes.
- Time spent for reading and writing operations (counters).
Tracking stats are enabled by default and there are no additional steps for configuring them (except for stats that are provided by contrib modules). Stats interface based on functions and views, these functions and views available by default in all existing and new created databases. Thus getting stats is possible using psql or any other client and SELECT queries to these views.
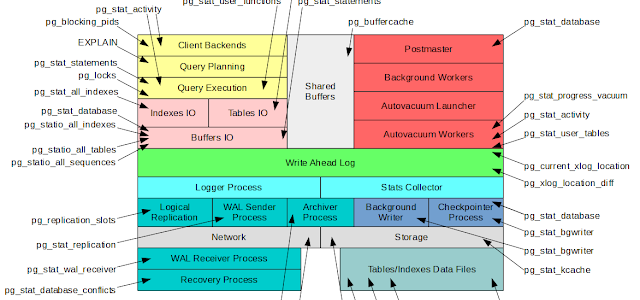
As mentioned above, there are many stats functions and views and in addition postgres has multiple subsystems. This information can be represented in the following diagram.

In my next post in this series I will be focusing on particular stats view and will explain what kind of problems it allows to solve and how to do it.